Since its start, the pandemic has spread to more than 180 countries, with governments around the world each reacting differently to the new global threat. The Oxford COVID-19 Government Response Tracker gauges the strictness of countries’ responses using a stringency index, which compares governmental policies over several dimensions.
It is important to note that a higher index score does not necessarily imply an effective response; alone it simply indicates that a government undertook stricter containment measures.1 Moreover, the stringency index tracks the geographical coverage of a policy. Namely, if a policy is solely implemented in certain regions, it receives a lower score than if it is nationwide.
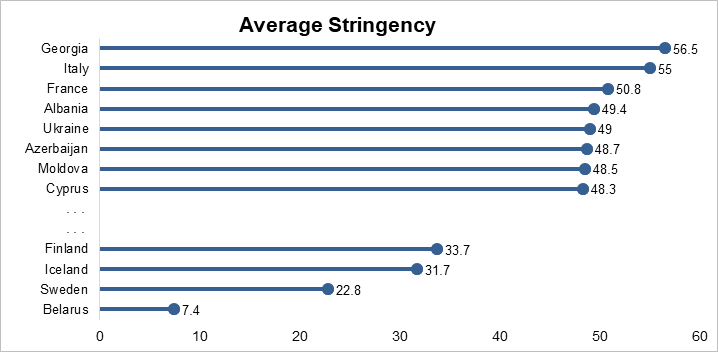
The index has been updated every day since 1 January, and according to the average index score (as of 15 June), Georgia ranks 1st in Europe and 4th worldwide, with an average of 56.5 (behind only China – 63.5, the Philippines – 59.3, and El Salvador – 56.8).
Due to the wide variety of containment/lockdown measures introduced by the Georgian Government in March, the country’s stringency index rose sharply. It increased to 89 on 23 March, reached 100 on 30 March and stayed at the maximum level until 25 April. As a result, Georgia was able to effectively contain the spread of the virus and was later classified as one of the most effective countries in its group, alongside Bosnia & Herzegovina and Kosovo, which also managed to successfully mitigate COVID-19.
The remainder of this blog will concentrate on certain countries across continental Europe and in our local region2, and demonstrate the relationship between the strictness of lockdown measures and the number of confirmed cases.
Chart 1. The average stringency levels in European and regional countries
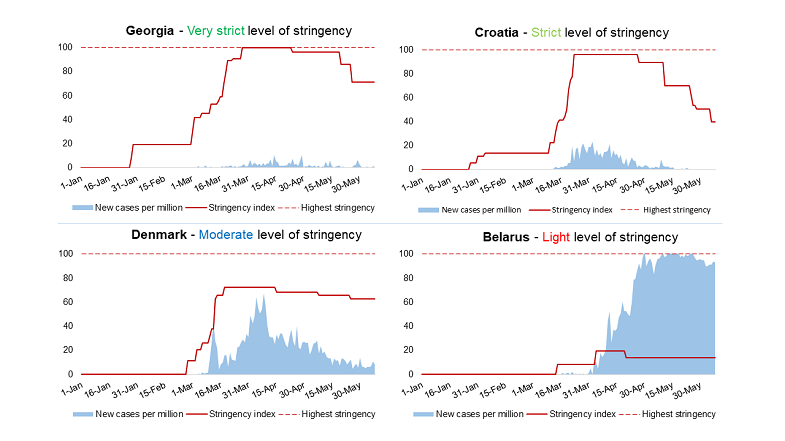
Consequently, we grouped countries into four categories based on their relative stringency levels: Light, Moderate, Strict, and Very Strict. Chart 2 below contrasts the dynamics of new cases (per million) vis-à-vis the strictness of policy measures across sample countries from each group.
Chart 2. Stringency (in red) and new cases per million (in blue) in select countries
From the first confirmed cases, the spread of the virus followed different paths in various countries: in some, the first case was followed by quick acceleration, whereas, in other instances, the growth rate was more stable. Because of these core differences, initial governmental responses varied. Thus, for our study, we treated the 50th case as the starting point, after which the progress of the virus was more dependent on governmental action. We grouped countries by their average stringency index during one week before the 50th confirmed case and three weeks after. Chart 3 demonstrates the evolution of new cases across different groups.
Chart 3. Evolution of new cases by average relative stringency index3

The study showed that on average there were, per million, 2745 fewer total new COVID-19 cases in countries with very strict policy responses, relative to the light group, and 1053 and 428 fewer than in the moderate and strict response groups, respectively. One can also see that almost all groups reached their peak in the fourth week (aside from the very strict group where the spread of the virus peaked a week later). By that stage, in the strict compared to the moderate response group, the number of new cases per million was 47% less. The country group-based analysis reveals that stricter, aggressive measures led to a decrease in not only the number of COVID-19 cases but also the duration of the outbreak. Interestingly, these findings are independent of the choice of time horizon used for averaging the stringency index.
In conclusion, with timely aggressive measures, Georgia has managed to mitigate the outbreak of COVID-19 much better than most European countries. However, the economic implications of the responses are also evident – Georgian GDP declined by 16.6% (YOY) in April and 13.5% in May. It is projected to fall by no less than 4 percent across the whole of 2020 and thus, the overall efficiency of government responses is yet to be assessed.
1 Containment measures include: school closures, workplace closures, canceling public events, limiting gatherings, closing public transport, stay-at-home requirements, restricting internal movement, restricting international travel, and public information campaigns.
2 Chart 1 shows the top eight and bottom four countries in the sample, ranked according to the average stringency index in 2020.
3 Countries with an average stringency index of more than one standard deviation below the mean have been placed in the Light group; countries with an average stringency below the mean within one standard deviation are in the Moderate group; and finally, countries with an average index higher than the mean within and beyond one standard deviation are categorized as Strict or Very Strict, respectively.
The views and analysis in this article belong solely to the author(s) and do not necessarily reflect the views
of the international School of Economics at TSU (ISET) or ISET Policty Institute.


 10
July
2023
10
July
2023


