The large and chronic water losses characterizing distribution networks constitute one of the major challenges faced by Georgian water utilities. The water supply generates approximately 700 million cubic meters of non-revenue water (NRW) each year1, considering just the urban centers. High water loss rates create excessive operational costs for the utilities and result in undesirable operational inefficiency in the water supply sector. This creates obstacles — from a financial point of view — to the achievement of full cost recovery and to the appropriate operation of the water supply infrastructure.
Directly, high loss rates in distribution networks result in NRW and higher water bills for the utilities. Indirectly, NRW increases the energy inputs required for water supply operations. This is the case especially in the half of mountainous regional municipalities in Georgia where electricity constitutes up to 30% of the company’s operational costs.
Another factor contributing to the deterioration of the operational efficiency of the water supply utilities in Georgia — as well as to the loss of water — is the low rate of metered connections. Normally, water utilities are not able to control water consumption levels for non-metered customers. These customers are charged per capita fixed tariffs, not conditional on their monthly water consumption levels. This, in turn, reduces their incentive to save water and to eliminate water losses on their property. As a result, the lower the metering rate, the higher the uncertainty about the company’s water balance and normative water loss levels.
Below, we will analyze the case of the United Water Supply Company of Georgia (UWSCG), looking at the evolution over time of the company’s key parameters, such as metering ratios in absolute and percentage terms, the growth rate of new connections, and municipal energy intensity as an input factor. Through graphical illustration, we will also show how household and business connections have evolved over the last 7 years. Based on the results of the analysis, we will discuss how targeted policy measures could benefit both water utilities and society at large.
UWSCG is a state-owned enterprise that coordinates the development of the water supply and sanitation network in regional municipal centers and plays a fundamental role in the context of the country’s sustainable development strategy, which emphasizes rural development. As of today, the company has 53 municipal and up to 9 regional service centers in Georgia and serves 306,000 households (HH) customers as well as 19,000 commercial/business customers.
METERED AND NON-METERED CUSTOMERS, UWSCG, 2011-2017
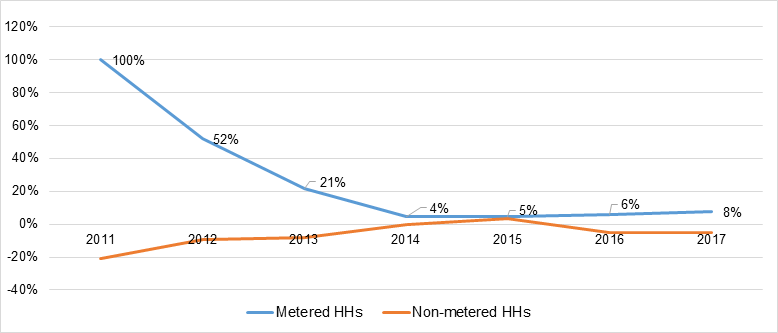
The graphs below illustrate the absolute and percentage changes in metered and non-metered HH customers’ connections in the UWSCG. Over the last 8-year period, the metering rate for HH customers grew at an average of 24%, with a sharp acceleration in the first years and a significantly lower growth (about 6% per year) over the last 4 years. Since 2017, the number of metered HH customers rose above that of un-metered customers. Still, in 2018 46% of households under UWSCG were still un-metered. As the meters are necessary to control water consumption and incentivize more efficient use of water, the low metering and the slowing growth rate of metering remain among the reasons for the system’s efficiency problems.
Figure 1. Metered and non-metered HH customers, UWSCG, 2011-2018
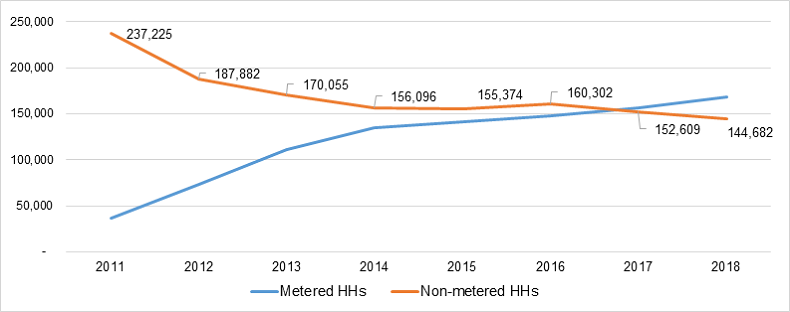
Figure 2. The growth rate of metering, year on year, UWSCG, 2011-2018
In analyzing the efficiency of the company, it is also important to examine the structure of its operational costs. The next figure shows that the UWSCG has different electricity input needs in various municipalities. In other words, the percentage share of electricity costs in total Operation and Maintenance (O&M) costs is radically different across municipalities. Electricity costs as a percent of total O&M costs are above 25% in almost half of the municipalities in which the UWSCG provides water supply services (see figure 3 below).
Figure 3. Percentage share of electricity in total O&M (UWSCG, 2018)
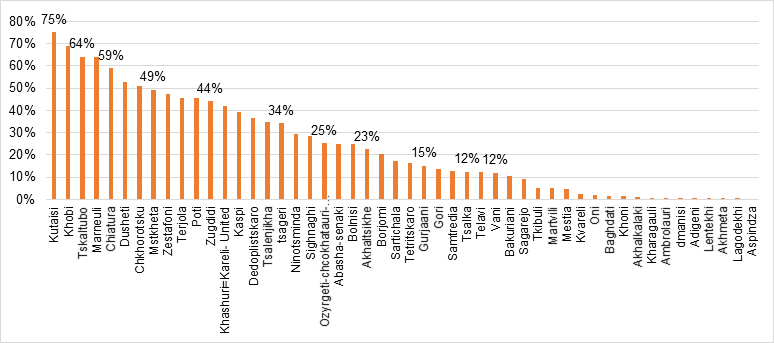
Clearly, municipalities characterized by high energy intensity contribute significantly to the company's overall operational costs.
Two “quick win” policy actions have been suggested by the Asian Development Bank in the context of the Country Operations Business Plan 2018-20202:
• improve UWSCG operational efficiency by reducing NRW from the declared 75% to the targeted 45% level;
• adopt energy-efficient technologies in the water production process, with potential savings of up to 35% of the electricity currently consumed.
Similar recommendations were put forward by other development partners such as the World Bank, the KFW, and the EIB who invest widely in our country’s water supply sector.
The analyses conducted at the Ministry of Regional Development and Infrastructure of Georgia revealed that the proposed policy implementation would reduce the demand for power between 109 and 219 million kWh of electricity annually (see figure 4.). Comparing the first two scenarios, it emerges that the company can save more from NRW reduction than from energy efficiency improvement. Combining the two policies would result in savings amounting to 219 million kWh of electricity.
Figure 4. Proposed policy impact on electricity consumption, million kWh, Source: MRDI 2019

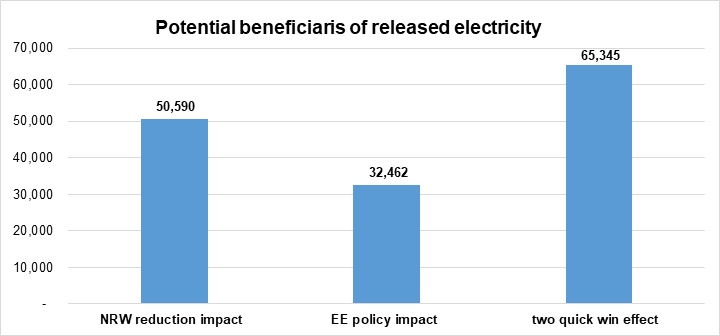
In order to have a clear understanding of the social relevance of the policy intervention, we performed a simple exercise. Dividing the total energy saved in each of the scenarios by the average annual electricity consumption per household member3, we estimated that the first policy scenario would save an amount of electricity equivalent to that consumed by 50,590 people in a year, while the number for the second scenario would be just 32,462. The third — and best-case scenario — is the double policy effect, which would save an amount of electricity sufficient to satisfy the electricity needs of more than 65,000 people for an entire year.
Given the fact that the operational losses of UWSCG are covered by the public budget, this is more than a fictional exercise. It gives an idea of how many resources could be freed yearly by increasing operational efficiency in the water sector. These resources — net of the costs associated with the implementation of the suggested policies — could be used, for example, to provide electricity vouchers to vulnerable households.
Figure 5. Number of potential beneficiaries and three policy scenarios, MRDI 2018
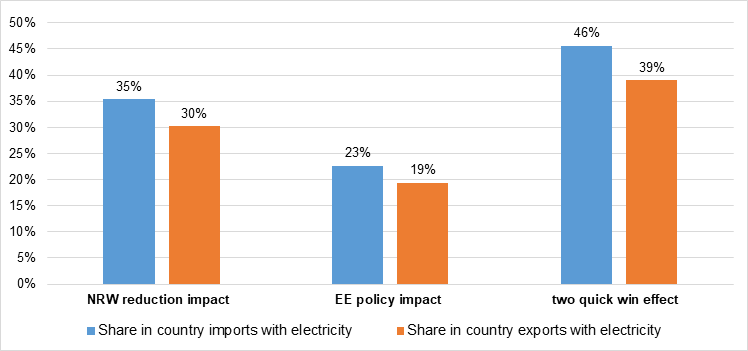
To illustrate the same concept from a different angle, we looked at the electricity saved as a percentage of the country’s electricity imports and electricity exports. Figure 7 below illustrates the policy intervention effects for three different scenarios. In the first scenario, the released electricity is equivalent to 35% and 30% of Georgia’s annual electricity import and export volumes, respectively. With the double policy intervention, the electricity saved rises to 46% and 39% of the country’s annual electricity import and export, respectively.
Figure 6. Saved electricity in percent of electricity imports and exports, 2017
What are the overall implications and conclusions from this case study?
The first is that, as electricity is quite a costly input factor in water generation, reducing its consumption would potentially save a substantial amount of financial resources that otherwise would have to be subtracted from the state budget to subsidize the company, freeing them for alternative uses.
The second is that, as the country’s overall demand for electricity consumption increases, a sensible water policy addressing the whole sector — not only the state-owned UWSCG — could contribute significantly to reducing the country’s dependence on electricity imports.
As we discussed, this could be done by defining specific policy targets to improve the water companies’ operational efficiency (such as reducing NRW and/or by adopting more energy-efficient technologies). Targeting efficiency improvement measures and water recovery mechanisms would also be a good way to start putting the water sector on track to meet its energy efficiency targets for 2030.
References
• Asian Development Bank (2011). Water Operational Plan 2011-2020. The institutional document, October 2011. https://www.adb.org/documents/water-operational-plan-2011-2020
• Asian Development Bank (2018). Capacity Building for National Energy and water supply regulatory commission, ADB MVV decon GmbH & Grant Thornton, 2018.
• Asian Development Bank (2018). Georgia: Country Operations Business Plan 2018-2020. (https://www.adb.org/documents/georgia-country-operations-business-plan-2018-2020);
• European Investment Bank (2011). Financing water and Climate Change adaptation- http://www.eib.org/attachments/strategies/water_and_climate_change_adaptation_en.pdf;
• European Union (2017). EU technical assistance and information exchange program – Obstacles in implementing EU water acquis;
• Frauendorfer, R. and Liemberger, R. (2010) The issues and Challenges of Reducing Non-Revenue Water, Asian Development Bank, 2010 https://www.adb.org/publications/issues-and-challenges-reducing-non-revenue-water;
• Georgian National Energy and Water supply regulatory Commission (2017). Annual report 2017, Water Supply Sector, http://gnerc.org/files/wliuri%20angariSi/2017%20Annual%20Report_opt.pdf;
• Tepnadze, M. (2018). “Strategic Analysis of the Water Supply and Sanitation in the Regional Settlements of Georgia, Ministry of Regional Development and Infrastructure of Georgia, Infrastructure policy and development partner’s relation department
• USAID – GGI (2018). Improving water and wastewater services in Georgia
• Weidel, H. (2018). UWSCG Business Plan, within the capacity building for GNERC
• World Bank. Energy Imports, https://data.worldbank.org/indicator/EG.IMP.CONS.ZS?view=chart
1 http://gnerc.org/files/wliuri%20angariSi/2017%20Annual%20Report_opt.pdf
2 https://www.adb.org/documents/georgia-country-operations-business-plan-2018-2020
3 Energy Consumption in Georgia (see: https://www.worlddata.info/asia/georgia/energy-consumption.php)
The views and analysis in this article belong solely to the author(s) and do not necessarily reflect the views
of the international School of Economics at TSU (ISET) or ISET Policty Institute.


 31
May
2023
31
May
2023


