 10
July
2023
ISET Economist Blog
 Friday,
22
March,
2019

 Friday,
22
March,
2019
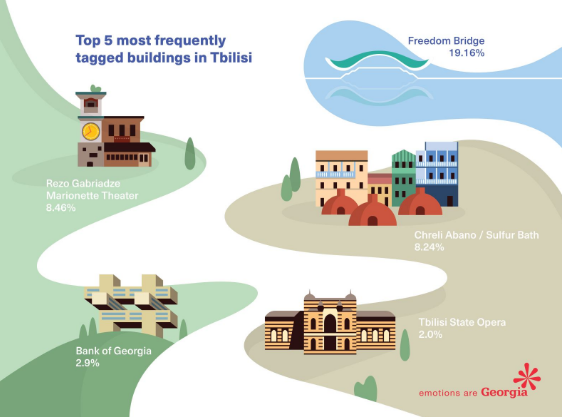
There are many mesmerizing buildings in Tbilisi, but do you know which one tourists favor the most? Or have you ever wondered what travelers’ favorite Georgian food or wine is? Thanks to modern tools and data-gathering methods, we now have actual proof that khachapuri is tourists’ all-time favorite Georgian dish. In 2018, the Georgian National Tourism Administration (GNTA), along with Communication Agency Windfor’s, launched a campaign called “Emotions are Georgia” to determine what foreign tourists admire the most in our beautiful country and which emotions they associate with Georgia. Through social media posts and with the help of complex Artificial Intelligence tools, the posts of more than 7 million tourists were analyzed. Popular social media platform Instagram was used as the data source of the campaign, and by utilizing information from photos and tags, Windfor’s identified the most popular Georgian dishes and wines and the most frequently visited buildings in Tbilisi. Turns out, one of the capital’s newest structures, Freedom Bridge, is tourists’ favorite architectural site in Tbilisi, with 19.16% of tags.

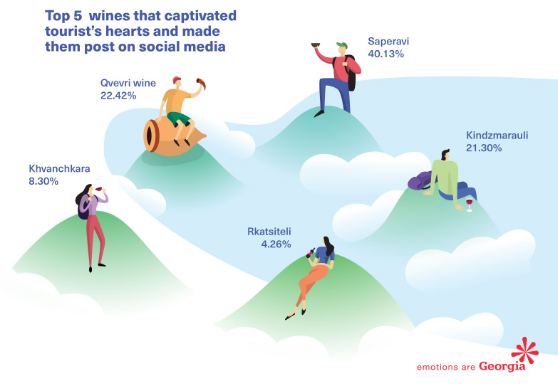
Second place is held by the Rezo Gabriadze Marionette Theatre with its peculiar clock tower. One of the oldest bathhouses in Abanotubani, Chreli Abano, followed very closely after the Marionette Theatre with 8.24% of tags, followed by the Bank of Georgia building (2.9%) and the Tbilisi State Opera (2.0%). Even though we Georgians have already heard many praises of our national cuisine and exceptional wine, the social media platform once again proved that admiration of Saperavi (40.13% of posts) and Georgian qvevri wine (22.42%) is not made up. Along with these two, Kindzmarauli (21.30%), Khvanchkara (8.30%), and Rkatsiteli (4.26%) constitute the top 5 wines “that captivated tourist’s hearts”.

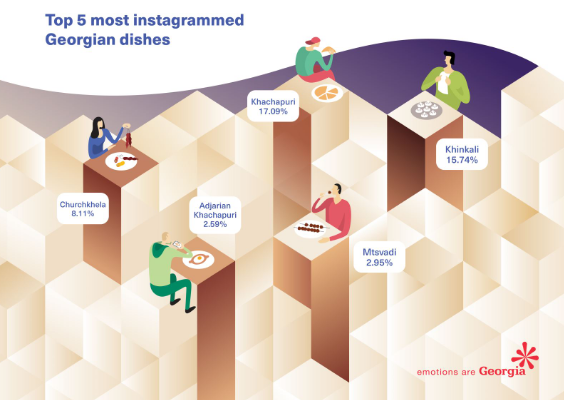
As for food, khachapuri with 17.09% of posts and khinkali with 15.74% are the leaders in Georgian cuisine. Traditional Georgian sweet churchkhela (8.11%), mtsvadi (2.95%) and Adjarian khachapuri (2.59%) also made the top 5 “most Instagrammed Georgian dishes”.

It’s easy to predict that travelers’ impressions and data about emotions towards our country are powerful instruments for marketing the strategic directions of Georgian tourism.
The same idea is captured in the “Georgian Tourism Strategy 2025” that states improvement of data collection and market research capabilities as one of the important directions and goals to better understand the requirements and peculiarities of the target tourism markets. Tourists’ requirements could be connected to tourism services, products, destinations, sightseeing, etc. Tourist travel behavior and activity patterns are the starting point for tourism practitioners and policymakers to better plan product development, suitable tourist service packages, and destination management, and to utilize the benefits of the tourism industry (Edwards et al. 2009; Lew and McKercher 2006). The spatial and temporal activities of tourists can be used to identify common touristic routes and develop new attractions and products along these routes (Lew and McKercher 2006).
Official data sources, like hotel records, museum admissions, and survey-based data, usually do not provide sufficiently detailed information about tourists’ whereabouts and activities. Moreover, traditional methods of data gathering like questionnaire-based surveys are time-consuming and limited in scale. These constraints in data hinder the development of broad tourism studies and create a need for alternative data sources. Fortunately, tourism is one of the fields where Big Data, a concept that has become well known in recent years, can offer many opportunities. Knowingly or unintentionally, at every step tourists leave their digital “footprint”. Digital data, Big Data, is generated by taking and uploading photographs, talking and sending messages on the phone, using social media, paying by card, and so on. All of these activities, as a source of data, make it possible to study tourists’ behavior when they visit different places (Salas-Olmedo et al. 2017).
European Commission tourism statistics identify alternative sources of Big Data that could be used in tourism market research, tourist behavior, and tourism spatial and temporal studies. These sources include communication systems, the world wide web, the business process generated data like financial transactions and flight booking systems, sensors that observe traffic, etc. (Demnuter, 2017). Communication systems are stated as one of the most commonly used sources of Big Data in tourism statistics. Data gathered from communication systems is a way of enriching existing data and serves as valuable complementary statistics.
Important sources included in communication systems are: mobile network operator (MNO) data and social media posts. These sources are most common for Big Data experiments that use the digital footprint of everyday communications.
MNO data is very commonly used and is the easiest Big Data source for measuring border crossings and tourist flows. The broad usage of mobile phones makes MNO data a highly relevant source for analyzing the presence and movements of tourists (Demnuter. 2017; Ahas et al. 2017). MNO statistics are being used for policy-making decisions and are gaining importance as a reliable source. One of the countries that widely uses MNO data is Estonia, where data analytics company Positium LBS, along with the Department of Geography of the University of Tartu, developed special software Positium Data Mediator that derives different statistical datasets from mobile networks. For tourism statistics, this software collects location and timing data of call activities from roaming phones that are described by pseudonymous ID and country of origin. This type of statistics can be used for inbound and outbound tourism research. Data from domestic phones can also be used for transportation networks and commuting studies (Ahas et al. 2017). Kuusik et al. (2010) also identify marketing concept and destination development studies as potential applications of mobile positioning-based statistics. Generally, the main users of MNO data are national banks, statistical bureaus, and researchers who are interested in additional sources of traditional data.
The main advantage of MNO data mobile positioning data is that mobile phones are widespread. Nowadays everyone has a cellphone, and some even have two. This makes data collection more cost-effective than traditional methods. Moreover, MNO data is geographically and temporally more accurate than traditional data. The main disadvantage of mobile tracking is related to privacy issues that require additional tools to convert MNO data into anonymous and pre-processed statistics. In the Estonian example, this tool is Positium Data Mediator. MNO data-related problems also include quite complicated utilization and handling procedures for huge volumes of data.
The Estonian example of modern data-gathering practice can be a basis to further develop mobile-based studies and improve data systems for countries like Georgia, which are in need of valuable market research for better planning to reach their strategic goals.
Over time, tourists’ behavior has changed and they are starting to turn to non-SIM-based services (messaging, alternative voice/video call systems). Dattilo et al. (2016) assessed that tourists use mobile phones on 90% of their domestic trips and only on 71% of their outbound trips. For this reason, mobile network operators are starting to use signaling data that captures all signaling events, billable and unbillable. According to De Meersman et al. (2016), the amount of useful signaling events is ten times more than that of call detail records.
Social media posts are also an important generator of tourism statistics. The primary advantage of mobile positioning data is that social media posts can provide more detailed contextual information. If MNO data can indicate where tourists have been as points on the map, social media posts can show where the tourist was located and in which activities they were engaged. Quan Vu et al. (2017) analyze the data derived from mobile social media platform Foursquare check-ins. Check-ins into different kinds of venues come with not only spatial and temporal data but also venue categories that can describe popular activities for tourists while traveling. The Georgian campaign by GNTA and Winfor’s is also an example of good use of social media posts.
As the importance of Big Data becomes obvious in market research, tourism statistics, product development, policymaking, and destination development, the significance of solely survey-based data is predicted to go down. According to Demunter (2017), three stages of Big Data evolution will crowd out the need for survey-based data. In the short term, Big Data will have an auxiliary role, while traditional survey-based data will remain the main source of statistics. In the mid-term, the importance of Big Data increases over surveys. In the long term, survey-based data will be partially replaced by alternative sources of Big Data. For countries like Georgia, keeping up with modern approaches of data generation means high-quality research, which in turn means reliable policy decisions for strategic industry development, implying the possibility of economic growth and progress.


