Have you ever wondered why the color of the United National Movement (UNM) is red while Georgian Dream (GD) is blue? Why not green and orange? It might be that red and blue offer a contrast, and they also symbolize quite different things.1 And, contrast is indeed what they each seek. These two parties have dominated Georgian politics since 2012, and it is now difficult to recall the subject they built a consensus around or even one that they have tried to discuss.
The Organization for Security and Co-operation in Europe (OSCE), in its report on the 2018 Presidential Elections of Georgia, made the following statement: “the campaign was dominated by controversial topics polarizing public opinion, negative campaigning and harsh accusations between the GD and UNM”. The organization suggests the depth of polarization went even further after the first round of the elections: “Campaign coverage by the major media outlets became sharper and more polarized. In particular, TV Imedi announced it would actively work to prevent the UNM candidate from winning and used its primetime news and current affairs programmes to strongly condemn the UNM and its candidate.”2
The OSCE refers to political polarization in Georgia, but exactly what does this term imply? A widely accepted definition notes the vast, aggregated ideological differences between parties and/or the electorate.3 Thus, to be able to highlight political polarization within Georgian politics, a sharp difference is required between the dominant parties and/or their supporters ideologically.
The Manifesto Project collects and analyses parties’ electoral programs (manifestos)4 in over 50 countries worldwide and accordingly, determines their right-left position.
The methodology the project employs is the following: the manifestos are parsed into quasi-sentences (statements) and then coded. The codes refer to certain variables (e.g. centralization)5 and indicate the percentage share of quasi-sentences within a manifesto. The graph below has been constructed according to the data provided by the Manifesto Project. The y-axis indicates the left-right leaning position of a party according to the RILE-index in which higher positive values indicate a right-wing position and negative values a left-wing position. A left-wing position is defined by the sum of frequency counts in manifestos favoring “State Intervention” and “Peace and Co-Operation”, “Democracy”, “Welfare State Expansion”, “Education”, and “Labour Groups”. Whereas, a right-wing position on the scale is constructed from the sum of frequency counts supporting “Freedom and Human Rights”, “Military”, “Capitalist Economy”, and “Social Conservatism”. The final index is then calculated by subtracting the frequencies of such left items from right items. The x-axis simply indicates the time parliamentary elections were held.
The graph reveals that both UNM and GD political positions, as reflected by election manifestos, are inconsistent over time. The UNM party, in terms of right-left leaning, has changed significantly in every single parliamentary election, while GD has also shown some change, moving gradually right from a more left-wing position.
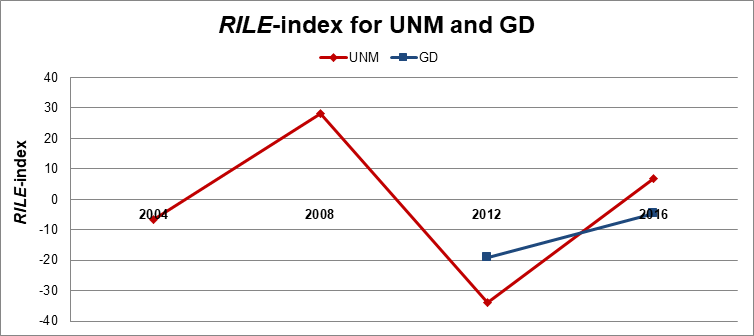
It is difficult to judge based only on two observations, however, it is still worthwhile noting the similarity in trends: in 2012, both parties tended to be more left-wing, while by 2016 they had both started to move towards the right. Thus, it seems that they actively try to converge with each other, which could be a predictor of the Median Voters Theorem, a phenomenon described by Duncan Black.6 According to the theorem, in order to maximize the number of votes, dominant parties will opt for a program favored by the median voter. Why the median? Targeting the median voter ensures the least relative distance to other voters, on average, in both directions along the left-to-right ideological spectrum, which therefore maximizes their number of potential votes. This, subsequently, offers an incentive for parties to converge on the median, and hence with each other.
To be able to apply this theorem to Georgia, the median voter should also be fluctuating quite a lot, which might well be true for the post-Soviet transitional country, where little political and economic experience has yet accumulated, and the electorate is still uncertain of which direction the state should take.
Thus, if not ideology, what tool remains to win elections in Georgia? The OSCE in its report characterizes the 2018 elections by its negative campaigning and the harsh accusations between the UNM and GD. Instead of focusing on their own innovative ideas and policies during their campaigns, both UNM and GD chose to portray each other as national enemies. What then can be the rationale behind this decision?
Certain academic works have claimed that creating enemy figures, and their images, are instrumental at the group level for increasing in-group cohesion.7 It has also been found that bonds are stronger when there is a shared dislike, rather than a fondness.8 Moreover, when fighting an enemy, the means are more easily justified than in other cases, simplifying the rules of the game. Thus, in order to mobilize the electorate, political parties may be more inclined to create enemies out of their opponents, rather than find ideological divisions.
We must ask of Georgian politics, is it political polarization we should discuss or just the lack of political culture? It seems the latter statement is more convincing, as the tool of winning elections is how well one can organize a negative campaign and not the fresh ideas and policies presented to the electorate. Consequently, we have one of the lowest voter turnout rates (53.88% on average) across post-Soviet countries.9
1 Although, those same colors may have different associations across cultures. See Mehta, R. and Zhu, R.J., (2009). Blue or red? Exploring the effect of color on cognitive task performances. Science, 323(5918), pp.1226-1229.
2 https://www.osce.org/odihr/elections/georgia/412724?download=true
3 Schmitt, J., (2016). How to Measure Ideological Polarization in Party Systems. ECPR Graduate Student Conference.
4 A manifesto is a published verbal declaration of the intentions, motives, or views of the issuer.
5 The higher the number of statements in favor of political decision-making at higher political levels, the higher the score of the centralization variable.
6 Black, D., (1948). On the rationale of group decision-making. Journal of political economy, 56(1), pp.23-34.
7 Allport, G. W., (1979). The nature of prejudice. Cambridge, MA: Perseus Books; Silverstein, B., (1992). The psychology of enemy images. In S. Staub & P. Green (Eds.), Psychology and social responsibility (pp. 145–164). New York: New York University Press.
8 https://onlinelibrary.wiley.com/doi/pdf/10.1111/j.1475-6811.2006.00109.x
9 See: http://www.electionguide.org/countries/id/81/
The views and analysis in this article belong solely to the author(s) and do not necessarily reflect the views
of the international School of Economics at TSU (ISET) or ISET Policty Institute.


 21
March
2022
21
March
2022


