

Indexes
November 30, 2016 FPI | ISET’s Retail Food Price Index Is Two Years Old


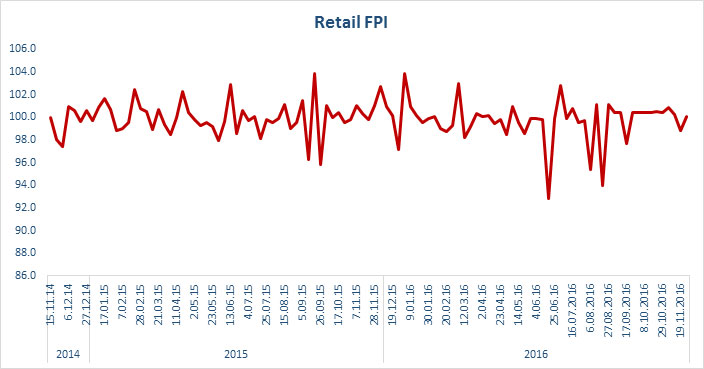
After a temporary increase at the end of October, driven by seasonal fruits and vegetables, in the last two weeks of November, ISET’s Retail Food Price Index decreased by 0.1% m/m (compared to the last week of October) and 12.1% y/y (compared to November 2015). We recorded the biggest drops for bananas (-12%), tomatoes (-12%), and beef (-7%). On the other hand, prices increased most for cabbage (10%), plums (8%), and cucumber (2%).
ISET-PI’s Retail Food Price Index (Retail FPI) was launched in November 2014, in cooperation with Georgia’s largest retail chains, including Carrefour, Goodwill, Fresco, and SPAR. While individual retailers’ data is kept confidential, average prices from all stores are combined to form a comprehensive index, as well as price indices for individual products or product categories (e.g., grocery, vegetables, dairy, etc.). The two-year dynamics of Retail FPI looks as follows (previous month=100):
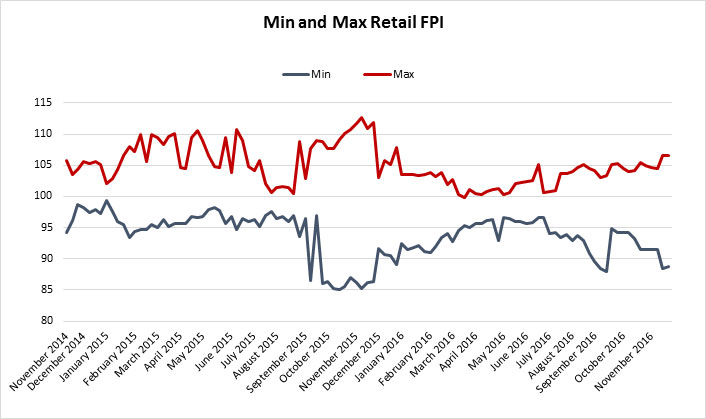
Competition among Georgian retailers is getting quite fierce. The following figure provides a comparison between the minimum and maximum prices offered by Georgia’s supermarkets. It is noticeable that there is a big divergence between the minimum and maximum Retail FPI during November-December 2015. Interestingly, in November 2016, we still observe a gap between those indicators. We may expect that the difference will become even larger next month. We suspect that this divergence is due to one supermarket being able to please consumers with lower prices and promotions for upcoming holidays.
It is interesting to compare ISET’s Retail FPI to Geostat FPI. In most cases, the changes in indices coincide or only slightly differ from each other. However, for August-October 2015 and 2016, the differences between the ISET and Geostat indices are significantly large.
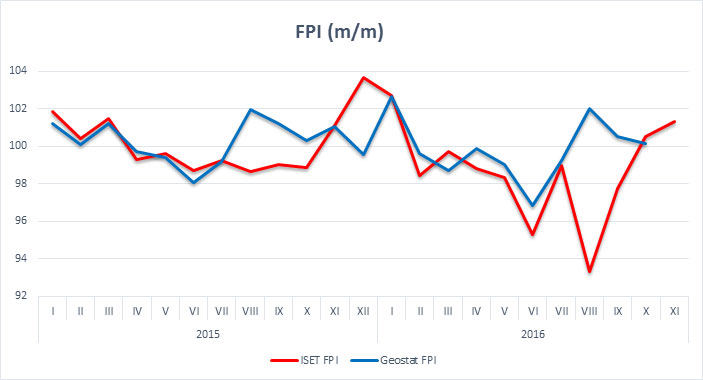
One possible explanation is that ISET FPI is comprised of 33 food products that account for 75% of food spending by an average Georgian household, while Geostat monitors the food basket that includes 92 products. It might be the case that the increase in Geostat food prices can be accounted for by the increase in prices of those goods that are observed by the National Statistics Office of Georgia but are not observed by ISET.
The second and more convincing reason for the divergence of food price indices in some cases may be the observed objects. As mentioned above, ISET FPI observes prices in the biggest supermarket chains in Georgia, while Geostat collects data not only from the biggest supermarket chains but also from the bazaar and bazaar-type objects and stores.
A very observant consumer would notice that the Geostat FPI is lower in December. The above difference in the amplitude of price reductions can be interpreted as a result of much higher price volatility in the bazaars and small stores than in the supermarket chains. This implies that the competition among the retailers in bazaars is stronger than between the supermarket chains in the food market during the holiday shopping fever season. To be more precise, small retailers are able to put out the products for sale faster than the supermarket chains. Accordingly, they increase the supply of food in the market and, therefore, “the invisible hand” leads prices to be more rapidly reduced in the bazaars than in the supermarket chains. In addition to this, it may be the case that the supermarket chains target different segments of consumers, and they are not concerned with the more rapid decline of the prices in the bazaars.
It turns out that Georgian consumers are faced with a difficult decision for the New Year: if Georgian consumers do not care about brands, commercials, and the pleasant environment provided by the supermarkets, they will go to the bazaars in order to buy cheaper food for holidays.
 12
January
2026
12
January
2026
In 2025, the Government of Georgia (GoG) continued subsidizing non-standard (lower-quality) tangerines, allocating 2.6 million GEL to the Autonomous Republic of Adjara. Local citrus processing companies that purchased non-standard tangerines from farmers for at least 40 tetri per kilogram, received a 35-tetri subsidy from the government.
08
October
2025
The National Statistics Office of Georgia (GeoStat) has published its second quarterly bulletin for 2025. The publication highlights that the real GDP in agriculture, forestry, and fishing decreased by 4.6% compared to the first quarter of 2024. Furthermore, agriculture contributed to 4.5% of the country’s total GDP during the first quarter of 2025.
30
June
2025
In June 2025, the National Statistics Office of Georgia released its annual publication on the agricultural sector, Agriculture of Georgia 2024. According to the report, agriculture, forestry, and fishing accounted for 6.2% of GDP in 2024 – slightly below previous years, yet consistent with the general trend of recent years, during which the sector’s share averaged 7–8%.
01
April
2025
The planned 2025 budget for the Ministry of Environment Protection and Agriculture (MEPA) amounts to 808.1 million GEL (an increase of 120.1 million GEL from the amount designated in 2024). The assigned budget was predominantly distributed across the following areas
10
January
2025
Apple production is mainly concentrated in the Shida Kartli region, which accounted for 71% of total production in 2023; beyond which, Mtskheta-Mtianeti contributed 8.5%, while Kvemo Kartli accounted for 7.3%.


