

Indexes
May 2015 Macro Review | First quarter closes with encouraging 3.2% growth. Export and import dynamics ease pressure on the value of Lari


According to Geostat’s rapid estimates, Georgia’s economy grew by 4.3% in March 2015. After the slowdown of the last several months, the growth rate in February and March looks very promising. In the first quarter of 2015, GDP growth amounted to 3.2%. In March, VAT payers’ turnover increased by 9.9% annually, and the total consumption of electricity increased by 6.2%. ISET’s GDP forecast for the second quarter of 2015 is even more optimistic, at 5.1%.
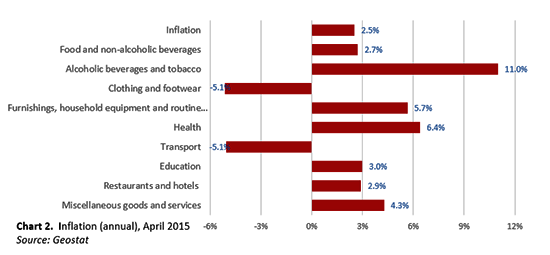
Despite the depreciation of the lari and pressure on inflationary expectations, annual CPI inflation reached just 2.5% in April. The increase in prices was driven to a large extent by food and non-alcoholic beverages (2.7%), healthcare (6.4%), alcoholic beverages, and tobacco (11%). The prices of alcoholic beverages and tobacco rose because excise tax on some of the products included in this category was increased. Taken together, these three categories contributed over 2 percentage points to the CPI inflation rate.
Despite the depreciation of the lari and pressure on inflationary expectations, annual CPI inflation reached just 2.5% in April. The increase in prices was driven to a large extent by food and non-alcoholic beverages (2.7%), healthcare (6.4%), alcoholic beverages, and tobacco (11%). The prices of alcoholic beverages and tobacco rose because excise tax on some of the products included in this category was increased. Taken together, these three categories contributed over 2 percentage points to the CPI inflation rate. At the same time, prices continued to fall on clothing and footwear, and transport – with both categories falling by -5.1% (see Chart 2). Producer price index (PPI) inflation was predictably much higher, at 7.2% annually.
While annual CPI inflation allows us to compare current prices with the same period last year, it may not accurately reflect the short-term price dynamics on the market. We thus need to look at monthly inflation rates. Between April and March, only a slight uptick in monthly inflation can be observed. Compared to March, overall prices increased by 0.3%. The price increases on the transport (1.8%), alcoholic beverages, and tobacco (1%) categories put upward pressure on monthly CPI inflation. However, the pressure was lessened by a price decline on food and non-alcoholic beverages (-0.3%) and other categories.
During January-April, exports from Georgia amounted to 689 million USD. The export volume was 26% lower than in the corresponding period last year. The volume of imports to Georgia decreased as well. Over the reporting period, imports amounted to 2,326 million USD, which is 8% less than the amount reported last year. Consequently, the trade deficit deteriorated by 3% and reached 1,637 million USD.
As can be seen from the graph below, imports show a negative growth dynamic – they have been declining steadily since December 2014. At the same time, the negative annual growth rate of exports, represented by the flattening red line on the graph, points to a downward shift in the level of exports, rather than negative growth dynamics. Insofar as the trade deficit is concerned, this is a rare piece of good news for the country. The decrease in the level of exports at the end of 2014 implies that annual growth rates in 2015 will be negative, but the level of exports will remain stable.
 23
March
2026
23
March
2026
Economic activity remained strong through the end of 2025, although the pace of expansion continued to normalize. According to preliminary estimates, real GDP growth reached 7.5% in 2025, indicating that output was still expanding above Georgia’s longer-run trend even as the economy gradually converged toward potential.
12
January
2026
According to preliminary indicators, real GDP grew about 6.5% y/y in Q3 2025 (Figure 1), easing from 7.3% in Q2 but still above the pre-2022 norm. Expansion remained services-led: summer tourism, ICT, and transport did most of the lifting, while manufacturing and construction/utilities were softer as re-exports normalized.
06
October
2025
According to GeoStat’s preliminary estimates in the second quarter of 2025, Georgia’s nominal GDP reached GEL 25 347.0 million, with a year-over-year real GDP growth of 7.3% and a GDP deflator change of 4.8%. Per-capita GDP stood at GEL 6,842. The economic expansion was largely driven by strong growth in several key sectors.
01
July
2025
According to GeoStat’s preliminary estimates in the first quarter of 2025, Georgia’s nominal GDP reached GEL 21,798.2 million, with a year-over-year real GDP growth of 9.8% and a GDP deflator change of 3.4%. The economic expansion was largely driven by strong growth in several key sectors. The most notable increases were observed in Education (+27.7%), Information and communication (+28.5%), Administrative and support service activities (29.7%), Human health and social work activities (17.9%).
28
February
2025
According to GeoStat’s preliminary estimates in the fourth quarter of 2024, Georgia’s nominal GDP reached GEL 25,309.6 million, with a year-over-year real GDP growth of 8.3% and a GDP deflator change of 4.0%. The economic expansion was largely driven by strong growth in several key sectors. The most notable increases were observed in Education (+36.2%), Information and communication (+29.7%), Human health and social work activities (23.6%), Mining and quarrying (22.5%).


