 30
June
2022
ISET Economist Blog
 Saturday,
25
March,
2017

 Saturday,
25
March,
2017
The labor market is always a hot topic in our country, and debate about it usually overheats as elections approach. Referring to unsatisfactory labor market indicators is always a good way to emphasize the mistakes and/or the inertia of the ruling parties. Another common way to score points is making pre-election promises of increased future employment. One way or another, parties always promise and voters always believe their promises (including unrealistic ones). The only thing which does not seem to be affected is the labor market, possibly because behind the talk there is little analysis, and without appropriate analysis, it is impossible to design effective policies.
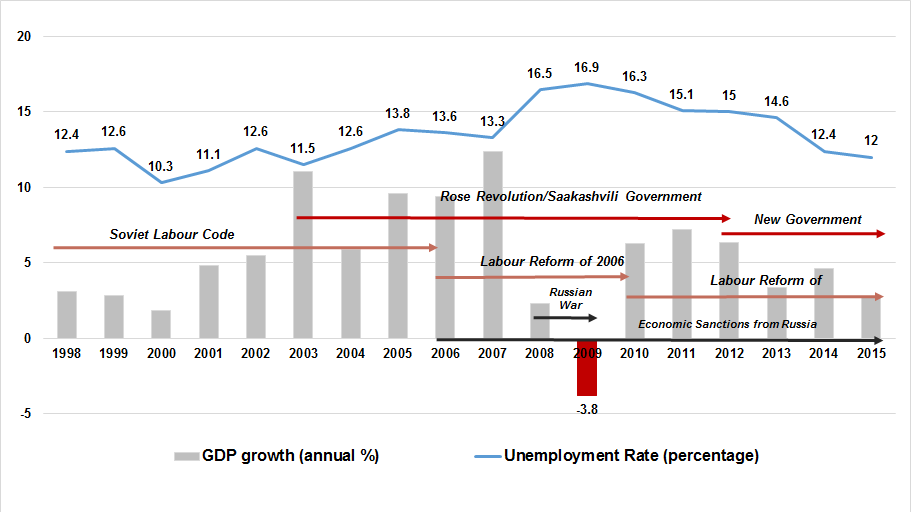
Look, for example, at the evolution of the unemployment rate – measuring the fraction of individuals without a job but looking for one, among those who are active in the labor market – probably the most frequently mentioned indicator. The Georgian economy has long been characterized by double-digit unemployment, which persists despite periods of strong economic growth and significant institutional changes. Figure 1 below shows that unemployment has not been responsive to economic growth, labor code changes, changes in state administration, or labor market policy changes. The 2008 war with Russia, and the subsequent financial crises, resulted in increased unemployment, but ultimately it reverted to around the 1998 level.
Figure 1. Unemployment and GDP trends (1998-2015)

However, aggregating individual outcomes in the unemployment rate hides what is happening at the micro-level, and gives us only a partial picture. Identical unemployment rates can be associated with very different labor market dynamics. A double-digit unemployment rate, for example, is much less problematic if there is a high probability of exiting unemployment in less than six months, than when that probability is low. Policies to tackle unemployment should differ depending on the circumstances.
Knowing more about such dynamics requires a micro-level analysis of flows into and out of labor market states. For this purpose, we looked at transitions characterizing the Georgian labor market in two periods ten years apart: 2004-2005, and 2014-2015. We focused on the transitions taking place between the 1st and 4th quarters of each year, using individual data from the Georgian Integrated Household Survey (IHS) collected by GeoStat. The observations of years 2004 and 2005 were combined, as are those of years 2014 and 2015, to increase the total number of observations.
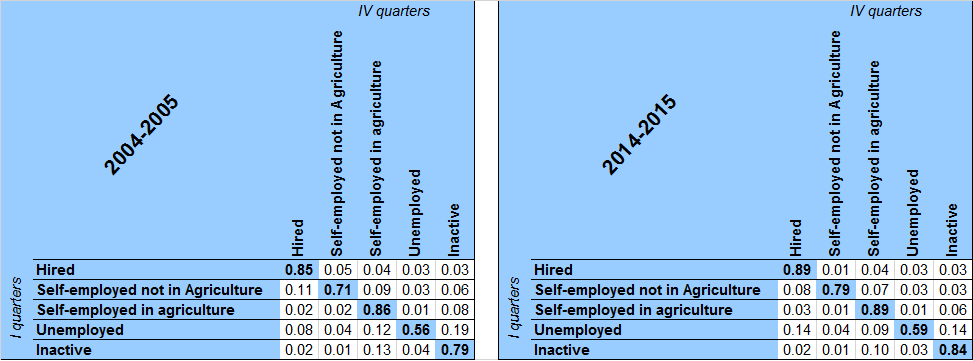
Transition matrices show us what percentage of individuals did change their labor market status during the selected periods (between quarters one and four), how likely they were to move from the state in which they were at the time, and to which state they moved, in those cases where movement occurred. We call this percentage transition probability. The numbers in Table 1 show the transition probabilities between the following labor market categories: hired employment, self-employment not in agriculture, self-employment in agriculture, unemployment, and inactivity (outside of the labor market) for the periods 2004-2005 and 2014-2015.
The matrices can be interpreted as follows: the number in each cell corresponds to the fraction of individuals in Quarter I who was in the state indicated in the corresponding row, and who in Quarter IV was in the state indicated in the corresponding column. For example, the 0.85 in the left upper corner of the first matrix (2004-2005) indicates that 85% of the individuals who were hired employees in the first quarter were still hired employees at the end of the year. The second value on the same row - 0.05 - indicates that 5% of these individuals had become self-employed, and so on. The percentage of individuals remaining in their initial labor market state can be seen in the diagonal of the matrix (bold numbers with grey background).
Table 1. Transition probabilities between 1st and 4th quarter, separately for 2004-2005 and 2014-2015 periods.

The first thing we observe is that – once in a labor market state – individuals appear more likely to stay than to leave. The transition probabilities are always higher on the diagonal than off the diagonal, for all initial states.
Another common pattern we identify is that, for all initial states, the probability to stay increases with the passing of time.
Beyond this, however, we can identify quite different patterns across labor market states.
The increase in the probability of staying in hired employment, for example, was compensated for by a lower probability of moving into self-employment outside agriculture.
Self-Employment outside of agriculture, in contrast, instead saw a reduction in the probability of moving to almost all other states except unemployment, which remained stable.
The self-employed in the agriculture category saw only marginal changes, among which the most noticeable is the reduction in the fraction of individuals moving to inactivity. The self-employed in agriculture appear to be a category apart, characterized by a substantially higher average age (53 years old in 2014-2015, much higher than any other category – see Table 2), which has been increasing with the passing of time. In another blog, we have suggested that the slow development and the land fragmentation of the agricultural sector in Georgia may be related to the poor labor market prospects of old (and aging) landowners, coupled with their disinclination to transfer their land to more entrepreneurial owners. The declining share of the self-employed in agriculture moving to other states is compatible with this intuition.
Table 2. Average age by labor market state: 2004-2005 and 2014-2015 periods.
| 2004-2005 | 2014-2015 | |
| Hired | 44.7 | 43.2 |
| Self-employed not in agriculture | 44.7 | 45.6 |
| Self-employed in agriculture | 49.1 | 53.0 |
| Unemployed | 35.9 | 34.4 |
| Inactive | 45.0 | 47.7 |
Source: GeoStat. IHS Database. Authors’ calculations
Over the years, the unemployed remained the most mobile group, showing an increased probability of finding jobs as hired employees, and a lower probability of exiting the labor market or engaging in self-employment in agriculture. While this is a promising trend, the percentage of individuals moving from employment to inactivity remains high (14%), suggesting that many unemployed individuals eventually stop looking for jobs after some time.
Finally, the labor market prospects of the inactive seem to have remained substantially unaltered. Inactive people are the less likely to move to hired employees, and it is the only category for which the probability of moving to hired employment has not increased over the years.
Even this small dive into micro-data has allowed us to learn a lot more about what is happening in the Georgian labor market. Despite the apparent persistence of unemployment, mobility across labor market states is non-negligible and, in recent years, has seen an increase in flows towards hired employment and self-employment not in agriculture (which includes the most “entrepreneurial” and “innovative” self-employed). Overall, this confirms an increase in employment opportunities, consistent with the aggregate data published by GeoStat (according to which, the number of employed is on the rise). On the negative side, the increase in the percentage of long-term unemployed (individuals who are unemployed for more than six months), raises concerns. Long-term unemployment is particularly costly, both for the individual – whose human capital depreciates with time and whose labor market perspective typically worsens as time passes – and for society, which sees a potential resource losing its value, especially if the unemployed individual ultimately leaves the labor market.
How does this relate to the initial point of this discussion? Designing policies that improve the labor market performance requires identifying the challenges faced by individuals who want to actively take part in it. This, in turn, requires access to more and better data than is currently available. For example, currently, the IHS does not follow individuals for more than four quarters. This makes it impossible to reconstruct labor market histories and estimate their impacts on future labor market outcomes. Also, the labor market survey section is quite limited and does not collect information about very important individual characteristics (such as personality traits), which play a crucial role in determining labor market outcomes.
Attempts to improve the performance of the Georgian labor market should start from this point, making sure the collection and the analysis of relevant data becomes a priority for GeoStat. Only once this is done can political discussions about labor market challenges become more constructive exercises.
This blog was produced in the scope of the ADB "Good Jobs for Inclusive Growth in Central and West Asia" Study.


