In the last two weeks, the lari depreciated, once again, against the US dollar. Georgian currency lost about eight tetri against its American counterpart, causing quite a stir in the media, among political groups and economic experts. While government authorities claimed that the recent developments are short-term fluctuations driven by negative expectations, Turkish lira depreciation, dollar’s global strengthening, and are therefore not connected to the fundamentals of the Georgian economy, the members of the opposition were quick to blame incompetent fiscal and monetary policy.
One must point out that in such a short period of time it is impossible for anyone to precisely determine the factors affecting the lari’s exchange rate. This is mainly due to data availability, or, to be more precise, due to its absence, as data on trade, FDI, remittances, and revenues from tourism for May are yet unknown. Therefore, any attempts to explain recent fluctuations by macroeconomic factors are just wild guesses. However, using Turkish lira fluctuations as an explanation for all lari “problems” seems to be a more logical (and at the same time easy) way to get rid of intrusive journalists.
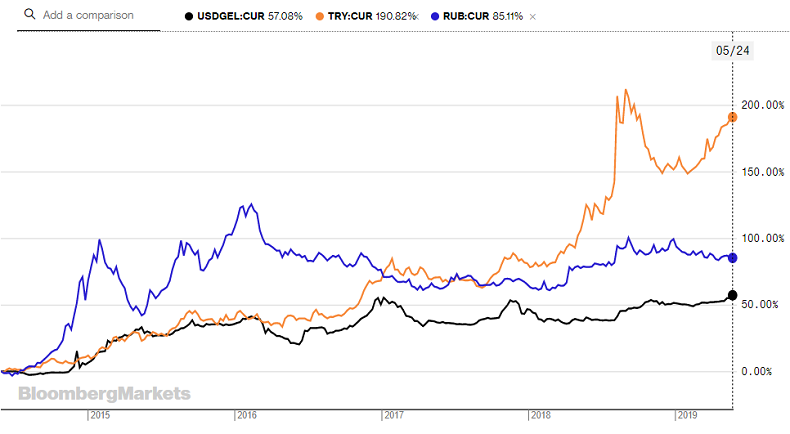
At the first glance, it may be easy to reach the conclusion of “co-movement” between these currencies. To observe the relationship one can simply look at the graph of exchange rate developments against the US dollar. Figure 1 shows a pattern for dollar appreciation against Georgian lari, Russian ruble, and Turkish lira in the last five years (upward movement indicates USD appreciation against the currency in question). From this trio, the lira weakened the most (by 190.82%), while the dollar gained “only” 57.08% compared to the lari. Despite the difference in the magnitudes of currency swings, their direction is visually similar. For example, lira and lari were moving side by side until 2018, while ruble and lari were repeating parallel paths since 2017.
Figure 1. US dollar against selected currencies
To measure and explain these relationships, economists use sophisticated econometric models which span many years. The non-economists may claim that these models are too esoteric – why not use an intuitive, “naïve” model, by calculating the degree of correlation between lari and other currencies? Surely, the degree of economic closeness with other countries in the region (be it Russia, Turkey, or Ukraine) could explain why lari would move in unison with their currencies and would provide an easy explanation for lari depreciation against the USD. For example, if a Georgian worker in Tukey earns his/her salary in lira and then transfers lira into USD in order to send remittances back to Georgia, a depreciation of Turkish lira against the USD would translate into less US dollars entering Georgia, and, therefore, would cause a higher price for USD on the Georgian internal currency market.
But in this blog, I want to demonstrate the drawbacks of using the naïve approach (simple correlations) for explaining currency movements in the short run. If we calculate a simple correlation between lari and other 40 currencies using NBG’s data on daily exchange rates for different periods (Table 1), the correlation between Georgian lari and Russian ruble is 0.85 for the last 5 years period and only 0.45 for June 2006 – June 2013 (period of the Russian embargo on Georgian exports). The correlation coefficient with Turkish lira and Azerbaijanian manat is calculated to be 0.81 and 0.89 respectively for the last 5 years. The results seem to be extremely logical, as these countries are our main trading partners, sources of remittances and tourism inflows for Georgia, and exchange rate fluctuations should transmit to lari through these and expectations channels1. However, the fact that we see the coefficients with the Belarussian ruble, Ukrainian hryvnia, Kuwaiti dinar, Norwegian krone, and Swedish krona to be higher than 0.9 destroys our previous argument. The good thing is that high positive correlations with almost all currencies in Table 1 hint that there were some common factors that simultaneously affected all countries (especially in the last five years)- e.g. global appreciation of the US dollar or oil price changes on the world markets. In order to disentangle these effects, one would need to use the sophisticated “esoteric” models.
Table 1. Georgian lari exchange rate correlation with other currencies.
| CURRENCY |
2003-2019 |
2003-JUNE 2006 |
JUNE 2006-JUNE 2013 |
LAST 5 YEARS |
| Armenian Dram |
0.60 |
0.91 |
0.54 |
0.92 |
| Australian Dollar |
0.55 |
0.72 |
0.03 |
0.90 |
| Azerbaijanian Manat |
0.90 |
0.60 |
0.08 |
0.89 |
| Belarussian Ruble |
0.80 |
-0.70 |
-0.01 |
0.95 |
| Bulgarian Lev |
0.83 |
0.66 |
0.57 |
0.79 |
| Canadian Dollar |
0.77 |
0.83 |
0.08 |
0.90 |
| Chinese Yuan |
-0.04 |
0.51 |
0.13 |
0.82 |
| Czech Koruna |
0.59 |
0.85 |
0.53 |
0.58 |
| Danish Krone |
0.83 |
0.66 |
0.56 |
0.79 |
| Egyptian Pound |
0.82 |
0.00 |
0.19 |
0.78 |
| Euro |
0.83 |
0.67 |
0.57 |
0.79 |
| Hungarian Forint |
0.83 |
0.48 |
0.51 |
0.84 |
| Iceland Krona |
0.18 |
0.18 |
0.22 |
-0.20 |
| Iranian Rial |
0.80 |
-0.94 |
0.03 |
0.82 |
| Israeli Sheqel |
-0.06 |
0.14 |
0.40 |
0.21 |
| Japanese Yen |
0.47 |
0.34 |
-0.15 |
0.51 |
| Kazakhstan Tenge |
0.85 |
0.91 |
0.17 |
0.89 |
| Kuwaiti Dinar |
0.88 |
0.82 |
0.74 |
0.93 |
| Moldovan Leu |
0.88 |
0.69 |
0.75 |
0.75 |
| Norwegian Krone |
0.93 |
0.74 |
0.44 |
0.92 |
| Polish Zloty |
0.79 |
0.84 |
0.58 |
0.79 |
| Pound Sterling |
0.74 |
0.72 |
0.34 |
0.84 |
| Romanian Leu |
0.83 |
0.70 |
0.44 |
0.89 |
| Russian Ruble |
0.87 |
0.82 |
0.45 |
0.85 |
| Serbian Dinar |
0.68 |
-0.71 |
0.45 |
0.75 |
| Singapore Dollar |
0.05 |
0.77 |
0.08 |
0.82 |
| Swedish Krona |
0.86 |
0.53 |
0.39 |
0.93 |
| Swiss Franc |
-0.09 |
0.64 |
0.09 |
0.79 |
| Tajikistan Somoni |
0.80 |
-0.41 |
0.27 |
0.91 |
| Turkish Lira |
0.84 |
0.52 |
0.29 |
0.81 |
| Turkmenistan Manat |
0.41 |
-0.15 |
-0.02 |
0.90 |
| Ukrainian Hryvnia |
0.86 |
0.66 |
0.40 |
0.95 |
| Uzbekistan Sum |
0.74 |
-0.81 |
|
0.68 |
Thus, we may conclude that the discussion of the causes behind lari short-term depreciation against the USD usually does not give any specific answers. Without delving deeper into data on current account and capital flows, any “definitive” explanation would turn out to be speculation at best and a lie at worst. Considering the fact that the currency crisis and political instability in Turkey already had a negative impact on the Georgian economy in the first quarter of 20192, we may guess, or expect the same scenario to repeat itself in the upcoming macroeconomic data. Or, perhaps, the data will have a completely different story to tell – we have to wait and see…
1 Correlation coefficients with 1 day, 1 week, 1 month, 1 quarter, and 2 quarter lags were calculated. The results are similar.
2 Export to Turkey fall by 33%, the number of international visitors and remittances from this country dropped by 15.7% and 22.6% respectively compared to the same period of last year.
The views and analysis in this article belong solely to the author(s) and do not necessarily reflect the views
of the international School of Economics at TSU (ISET) or ISET Policty Institute.


 02
July
2024
02
July
2024


